Analyzing and optimizing your selling guide
Once your selling guide is live on your website you can start analyzing its performance. You can analyze and optimize the performance and gain insights of your users in multiple ways:
- Analyzing Qonfi performance in Google Analytics 4
- Analyze user behavior through Qonfi and optimize your configuration and assortment
- Viewing the user interactions in Qonfi
1. Analyzing Qonfi performance in Google Analytics 4 (GA4)
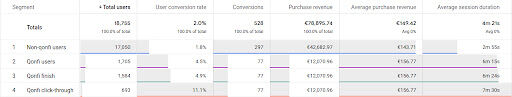
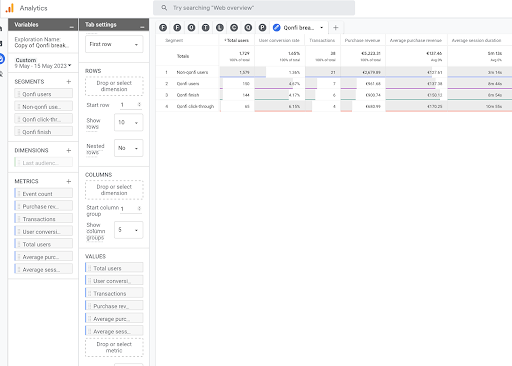
If you are using Google Analytics 4 (GA4), you can gain more insights in the performance of your guided selling and analyze additional data points. Once you are tracking your Qonfi events in GA4 you can benchmark the performance of Qonfi users vs. non-Qonfi users. For instance, you can create the table below in GA4 where you can monitor the performance of Qonfi users vs. non-Qonfi users on several metrics such as conversion rate, average purchase revenue, conversions, revenue, users, session duration and more.
Let’s create this table in GA4.
Creating Qonfi users segments in GA4
Login to GA4, In the left navigation click on the explore tab and click on ‘create a new exploration’. Add the following segments:
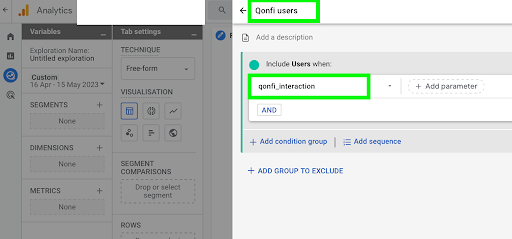
1. Qonfi user segment: Add a new segment → user segment → click on ‘add new condition’ → search and select ‘qonfi_interaction’ → give your segment a name (e.g. Qonfi users) → on the right click ‘save and apply’.
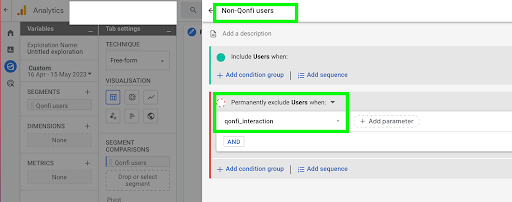
2. Non-Qonfi user segment: Add a new segment → user segment → click on ‘add group to exclude’ → click on ‘add new condition’ → search and select ‘qonfi_interaction’ → click on ‘temporarily exclude users when’ drop-down and select ‘permanently exclude users when’ → give your segment a name (e.g. Non-Qonfi users) → on the right click ‘save and apply’.
3. Qonfi finisher segment: Add a new segment → user segment → click on ‘add new condition’ → search and select ‘qonfi_interaction’ → click on ‘add parameter’ and select ‘qonfi_is_finish contains true’ → give your segment a name (e.g. Qonfi finishers) → on the right click ‘save and apply’.

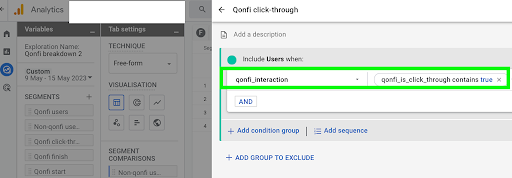
4. Qonfi click-through segment: Add a new segment → user segment → click on ‘add new condition’ → search and select ‘qonfi_interaction’ → click on ‘add parameter’ and select ‘qonfi_is_click_through contains true’ → give your segment a name (e.g. Qonfi click-through ) → on the right click ‘save and apply’.
Setting up your guided selling performance report in GA4
- Make sure to add the segments to the ‘segment comparison section’.
- Select and import your preferred metrics to benchmark. In our example we have imported ‘transactions’, ‘total users’, ‘user conversion rate’, ‘purchase revenue’, ‘average purchase revenue’ and ‘average session duration’.
- Add the imported metrics as values to your report.
2. Analyze user behaviour through Qonfi and optimize your configuration and assortment
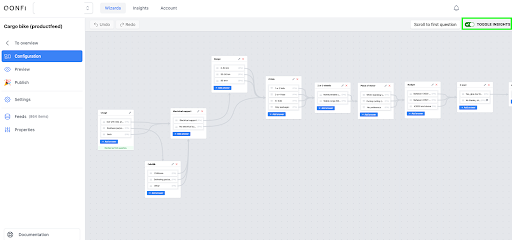
By using the ‘toggle’ switch within the ‘configuration’ section in Qonfi (top-right), you can get insights into how users behave and use your configuration. When the toggle is switched on, you can see how many percent of your users click on a particular answer. This gives you insights into which answers are preferred by your users and which aren't.
With these insights you can, for instance, decide to increase your product assortment for a particular product property (if you see that most users prefer a certain property and your assortment on this product property is relatively small). You can also change your answers, change or add descriptions or change your questions to optimize your selling guide further.
Follow these steps to toggle the insights:
- Log in to the Qonfi Interface and go to your wizard.
- Click ‘configuration’ in the left navigation.
- In the top right click on the ‘toggle insights’ switch.
The percentage of users who clicked on an answer is now displayed in the configuration for each answer.
3. Viewing user interactions in Qonfi
In the ‘insights’ tab, you can view the interactions of your users with Qonfi. Each click is considered an interaction. You can see the interactions per day, interactions of the last 30 days and the interactions of the last 12 months.
- To get to the insights tab, follow these steps:
- Log in to the Qonfi Interface click on the ‘insights’ tab, next to ‘wizards’ and ‘Account’.